

The CPU or central processing unit is a hardware component of a computer that carries out instructions from software. The CPU can be thought of as the computer brain. So as you can guess complete utilization of the CPU resources means that everything has to wait for spare CPU cycles.
In this blog post, we will look into how to gather information about the CPU also known as the processor, from current CPU utilization to historical data on a Linux system via the command line.
Gathering Context
Before we can make sense of the CPU usage it is best to check CPU information to gather context about how many processors, cores, and threads the system has. Below is a command that will list the information.
lscpu | grep -h "Thread(s)\|Core(s)\|Socket(s)"
The output will look something like this.
Thread(s) per core:                 2
Core(s) per socket:                 4
Socket(s):                          1
- Thread(s): tells us the threads per core.
- Core(s): tells us the number of cores per processor.
- Socket(s): tells us how many processors there are.
Note: If you need more details like the model name of the processor you can use lscpu without the grep as shown above.
More Than One Thread Per Core.
If you see more than one thread more core this is likely the work of hyperthreading or a simmular technology, which allows for virtual cores on a single physical core.
graphical utility options
Monitor CPU Usage From the Command Line
The below section will go over some examples of Linux commands that can be used to monitor the current CPU usage.
Using The PS Command
The ps command is part of gnu coreutils, which lists the process ID, CPU usage, and the command.
ps -eo pid,pcpu,comm
The output from the above command would then look like the following though longer
    PID %CPU COMMAND
      1  0.0 systemd
      2  0.0 kthreadd
      3  0.0 rcu_gp
      4  0.0 rcu_par_gp
      5  0.0 slub_flushwq
      6  0.0 netns
      8  0.0 kworker/0:0H-events_highpri
     11  0.0 mm_percpu_wq
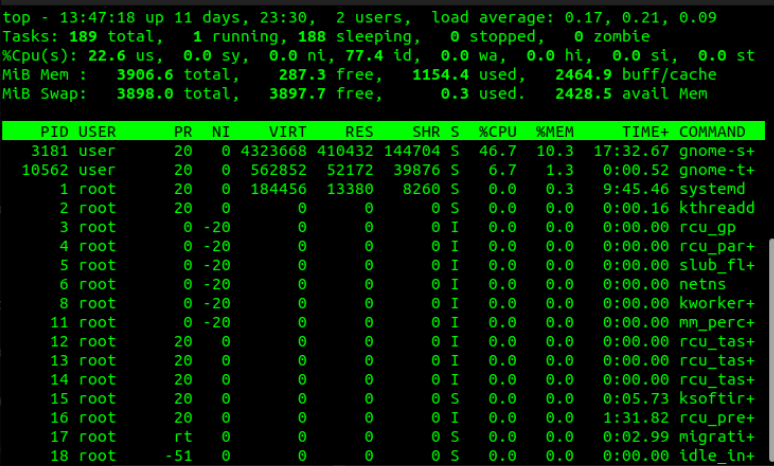
Using The Top Command
The top command defaults to using CPU usage in most cases.
top
Htop
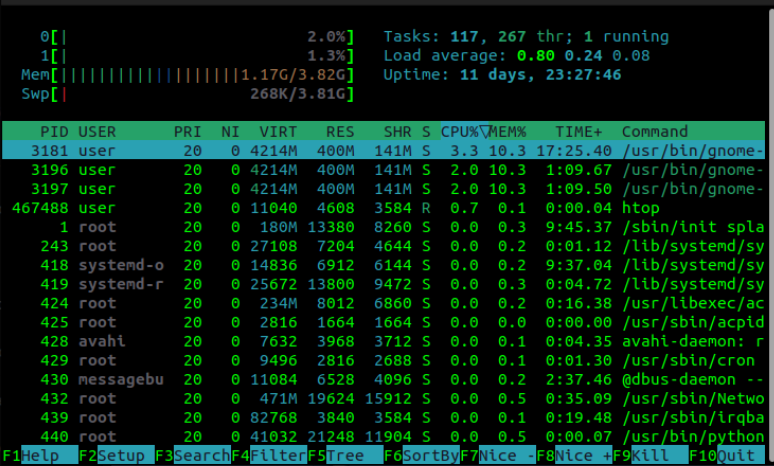
The htop command line tool is simmular to the top command and is aimed at making things more human-readable. It should be noted that that is not the official reason for the h in though it isn’t a bad way to remember the difference.
To Install
In most Linux distributions you can install the package through the package manager the package name will be htop for most.
The installation docs are listed on the official website.
Once installed you run the following command
htop
Historical CPU Usage Statistics
If you want to look at historical CPU usage will need to have a method of logging the data ahead of time. For now, let’s focus on a simple solution to gather that data.
The Sar Command
The Sar command is the simplest way to gather historical system data. It gathers includes CPU, Memory usage, Disk usage, and load to name a few. It gathers this data once every 10 minutes and then when you run the command displays the information in a table.
To Install
For Debian and Ubuntu systems
sudo apt install sysstat
For RHEL and derivatives
sudo dnf install sysstat
To Start And Enable
To make sure it is installed and started run
sudo systemctl enable sysstat && sudo systemctl start sysstat
To Check
To Check the starts in sar run the following command
sar
The Output will look something like the following
11:00:00 AM     CPU     %user     %nice   %system   %iowait    %steal     %idle
11:10:00 AM     all      0.29      0.00      0.08      0.28      0.00     99.35
11:20:04 AM     all      0.28      0.00      0.09      2.49      0.00     97.14
11:30:06 AM     all      0.11      0.00      0.08      0.20      0.00     99.61
11:40:00 AM     all      0.29      0.00      0.09      2.51      0.00     97.11
11:50:10 AM     all      0.28      0.00      0.09      0.08      0.00     99.56
12:00:09 PM     all      0.10      0.00      0.07      2.41      0.00     97.42
12:10:07 PM     all      0.29      0.00      0.09      0.42      0.00     99.21
12:20:15 PM     all      0.28      0.00      0.09      2.00      0.00     97.64
12:30:10 PM     all      0.20      0.00      0.09      1.41      0.00     98.30
Average:        all      0.24      0.00      0.09      1.55      0.00     98.13
- %user: is the CPU percentage from user processes
- %system: is the CPU percentage from system processes
Note: About Gathering CPU Usage Data From Many Servers
If you need data from many servers the general recommended to have a centralized system that either pulls from the servers or is pushed to the centralled collection server.
Using a system like this makes collecting the data quite a bit more complicated, so think carefully before implementing it.
If you decide to go down this route my recommendation is to use promethus. This ends up being made up of a few components the Prometheus exporter, Prometheus, and the dashboard used to display the data. For CPU usage the exporter you would want to use is the node exporter. To make things easier to read I use Grafana as the dashboard.
Below is how the components connect.
Node Exporter (To Expose) => Prometheus (To Collect) => Grafana (To View)
Frequency Asked Questions
Is The Load Average The Same As CPU Usage?
Another term you may hear when it comes to looking into resource usage is the load average. Be aware that as in the name, average implies there is a calculation being made to generate the load average. This means the the average CPU utilization or usage isn’t directly respresented by the load average.
CPU Usage Percentage Is Over 100%?
The CPU utilization percentage of 100% represents the complete utilization of one CPU core. With hyper-threading this means CPU usage of 200% would be using the same as one physical core.
How So I Stop A Process ID?
You can follow the blog post on how to kill a process.
Conclusion
The CPU is a computer’s brain, in this post, we started by discussing how to gather information about the processor using the lscpu command line tool. From there moved on to how to check current CPU usage in various ways. Then touched on historical CPU usage using Sar and went through a few frequency-asked questions

Embracing a lifelong passion for technology since childhood, CJ delved into the intricate workings of systems, captivated by the desire to understand the unknown. This innate curiosity led to his discovery of Linux, a revelation that resonated deeply. With more than 7 years of on the job experience, he’s honed his technical skills as a Geek and Senior Linux Systems Administrator.
Leave a Reply