
When coding a program, you usually have a full IDE set up with autocomplete and stack tracing, allowing you to pause execution at any point and see what’s going on under the hood. These tools make coding more productive, and they’ve been in use for a long time. But what if you’re just quickly coding some scripts in bash and don’t have access to the helpful stack traces? Those of us who used to code before IDEs know that the process can be frustrating, with continuous debug statements printed to the standard output. Fortunately, bash has tools to make our lives a bit easier with the “set -x” and PS4 variables, allowing us to see what’s going on under the hood of a script full of variables and expansions.
Let’s see how it works.
Creating a Test Script
In my bash terminal, I’ve created the following script:

This is a simple script that prints three lines using a “for” loop that iterates over a sequence from 1 to a defined variable, and then calls a function to print a string that includes that variable. I’ve created the script using the HEREDOC syntax. In the second command, I make the script executable. When I run it, here’s what I get:
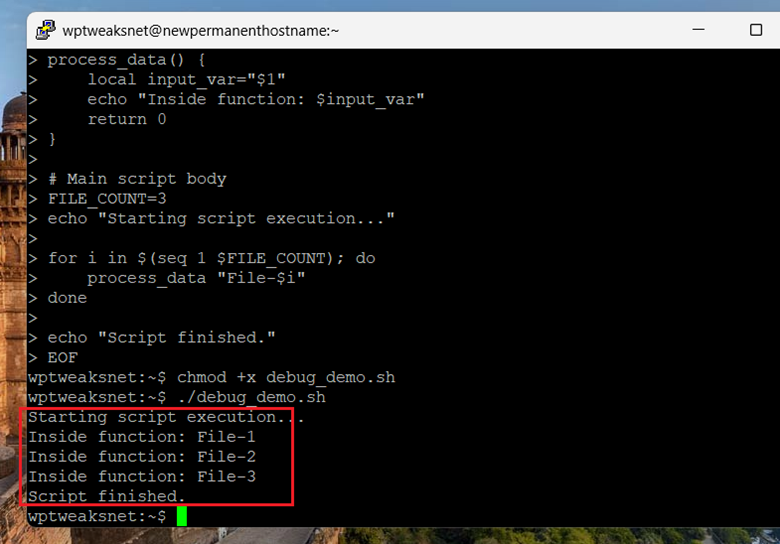
As you can see, the script is a straightforward one. It consists of a function and the main body. The most important part of the script that needs looking at is this one:
for i in $(seq 1 $FILE_COUNT);
The above statement increments the variable “i” by using the “seq” command to count up to the variable $FILE_COUNT. If we’re not getting the output we expect, then we want to see exactly how this statement was resolved, as well as all the statements that used the variable.
Debugging the Script with “set -x”
Now let’s see how we can debug this script using the “set -x” command. At the top of the script, after the first line saying ” #!/bin/bash”, we add the following:
set -x
Now, when we save our changes and run the script again, here’s what we see:

This time, between the outputs of the function itself, we see several lines starting with a plus (+) sign – this is the default PS4 variable – more on that later.
Whenever a command containing a variable or an expansion is executed, the expansion or variable is evaluated before the command itself. So for the line:
for i in $(seq 1 $FILE_COUNT);
We see that bash has expanded “seq 1 $FILE_COUNT” and made it “seq 1 3”. At the very beginning of the script, bash has printed the variable “FILE_COUNT” as having the value of “3”. From here on out, every command is fully expanded before the output is shown. So before the output:
Inside function: File-2
We can see that bash has first printed:
+ echo 'Inside function: File-2'
Along with the line:
+ local input_var=File-2
This way, we can see clearly which commands were executed to produce the output that we see. When executing commands with multiple expansions, including variables that keep changing, the “set -x” option allows us to see exactly what’s going on when an output doesn’t conform to our expectations. It’s pretty useful to examine the endpoints of loops, which can be tricky.
Customizing the PS4 Variable
The above output is useful, but it can be made even better. The PS4 variable is the one that bash uses to start the output when “set -x” is enabled. By default, we can see that it’s the plus sign (+), but bash allows us to customize it.
Why Customize the PS4 Variable?
While using the “set -x” command to see the actual commands being executed after expansions is very useful, it’s still not enough information for proper debugging. What’s the use of seeing something wrong if you can’t see where it is? The PS4 variable allows us to add “metadata” to scripts along with the command executions, so we can see not only what’s going on, but where.
For example, if we see a command that doesn’t make sense, we’d also like to know the following:
- The script name
- The line number
- The function name
These three things we should know, at the very least. Depending on the context, it might also be useful to know things like the username and the date on which the script was run. The latter two might seem odd, but you can set scripts in such a way that you redirect the “set -x” output to a file for later examination, and the person who runs the script might not be you, but someone else.
To incorporate the above details into our debugging process, we change the PS4 variable like this:
export PS4='+${BASH_SOURCE}:${LINENO}:${FUNCNAME[0]}: '
Now that we’ve modified the PS4 variable, we run the script again. Here’s what we get:
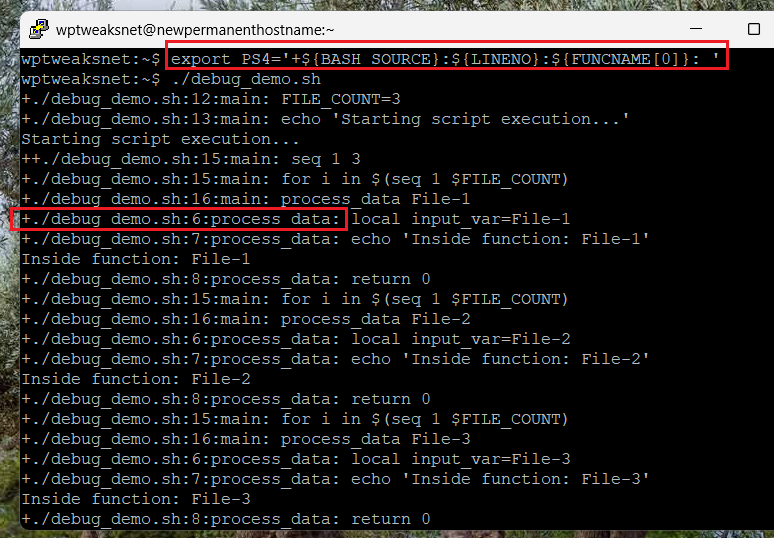
In the above screenshot, we’ve utilized some built-in variables to configure the PS4 variable, telling bash to show us the source file, the line number, and the function name. Here, you can see in the highlighted section that the source file is “debug_demo.sh”, the line number is “6”, and the function name is “process_data”. This information is enough for us to pin down exactly what’s going on and where.
For a simple script like the one above, of course, we don’t need to know the file name, and we already know where the statements are being executed. But in a large project, where scripts are calling one another, this information is critical.
Possible Pieces of Information
While I find the above three pieces of information most useful, there are other pieces of data that we can extract as well. Here’s a list of some of the most common special variables we can use while setting the PS4 variable:
- ${BASH_SOURCE} – the source file
- ${LINENO} – the line number
- ${FUNCNAME[0]} – the function name
- ${PPID} – the process ID of the parent shell
- ${SECONDS} – the number of seconds since the shell was started
Note that while “${FUNCNAME[0]}” is the variable holding the name of the currently executing function, you can also find the name of the function that called it by incrementing the index. So “${FUNCNAME[1]}” will contain the name of the function one level up the stack.
You can combine these two to create a function calling stack. For example, the following command:
export PS4='${FUNCNAME[1]}->${FUNCNAME[0]}: '
Will give this output:
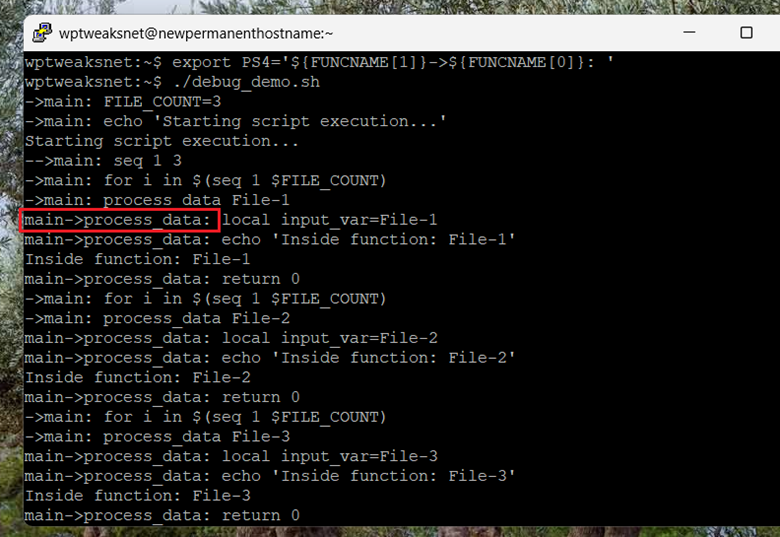
In the highlighted section, we can see that the calling function “main” called the child function “process_data”. With this information, you now have a full stack trace for the command you want to debug.
Conclusion
Coding scripts in bash usually robs you of your usual dev environment with the IDE, autocorrect, and so on. But that doesn’t mean you’re completely in the dark. Using bash tools like “set -x”, you can get a complete trace of all the commands that are executed, with their expansions. And by setting the PS4 variable, you can see exactly where those commands occur, which functions are responsible for calling and running them, as well as which user generated the output. Using these tools, you have a comprehensive overview of how your script executes, even though it’s not with the same polish and ease of use that you get with a regular IDE.

I’m a NameHero team member, and an expert on WordPress and web hosting. I’ve been in this industry since 2008. I’ve also developed apps on Android and have written extensive tutorials on managing Linux servers. You can contact me on my website WP-Tweaks.com!
Leave a Reply